When you look at a graph, one of the simplest shapes you’ll see is a straight line. A line doesn’t curve or bend—it moves in one constant direction.
Think about real life: many situations can be represented by a straight line.
- Example 1: Taxi fare – Imagine a taxi that charges a $3 base fee, plus $2 for every mile you ride. The total cost goes up in a straight, predictable way as you travel more miles.
- Example 2: Cell phone plan – A plan might have a $10 monthly fee, plus $5 for every gigabyte of data you use. Again, the cost increases steadily.
We can describe these kinds of relationships with an equation in slope-intercept form:
y= mx + b
- m = slope → the rate of change (how quickly y increases or decreases as x changes).
- In the taxi example, the slope is 2, because the price goes up $2 for each mile.
- b = y-intercept → the starting value, or where the line crosses the y-axis.
- In the taxi example, the y-intercept is 3, because the ride costs $3 before you even travel a mile.
So the equation for the taxi ride would look like: y=2x+3
This means:
- Start at $3 (the y-intercept).
- Add $2 for every mile you go (the slope).
When graphed, this equation makes a straight line that shows the relationship between miles and cost.
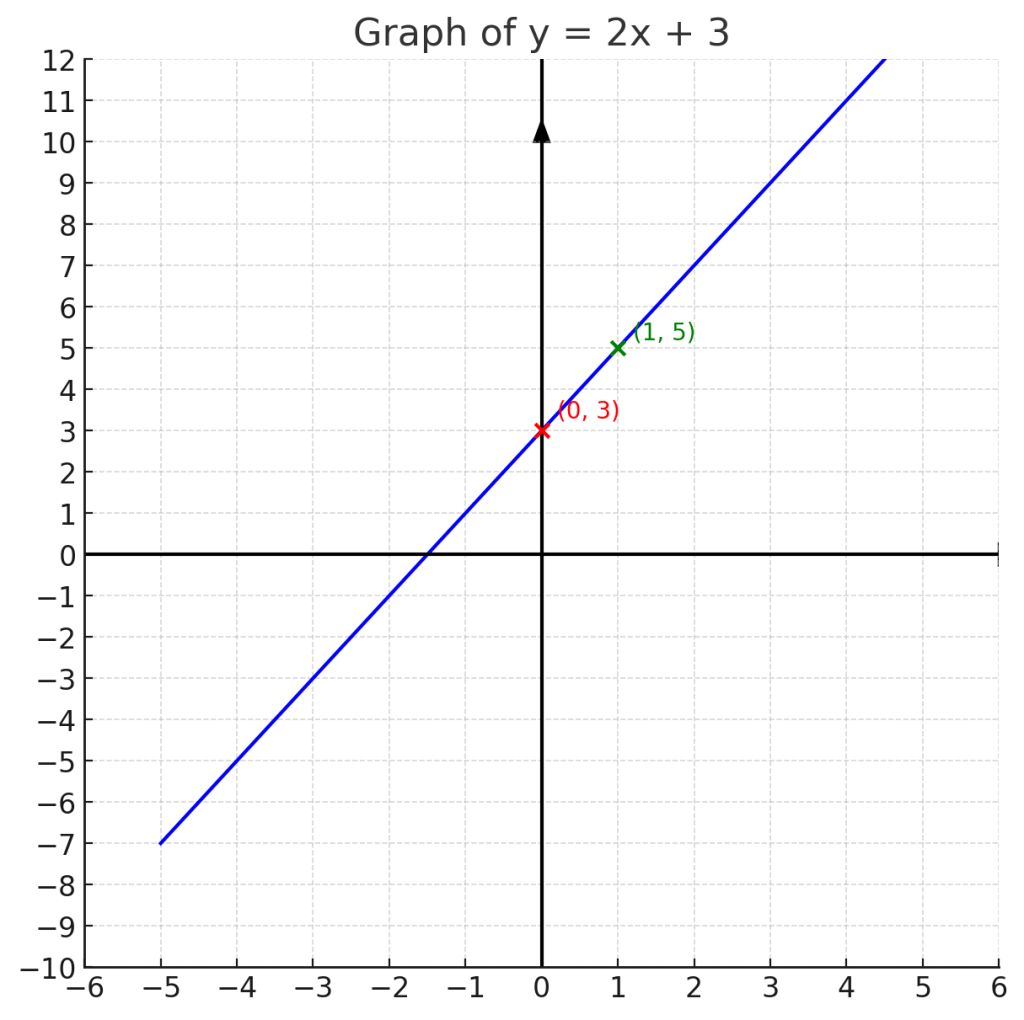
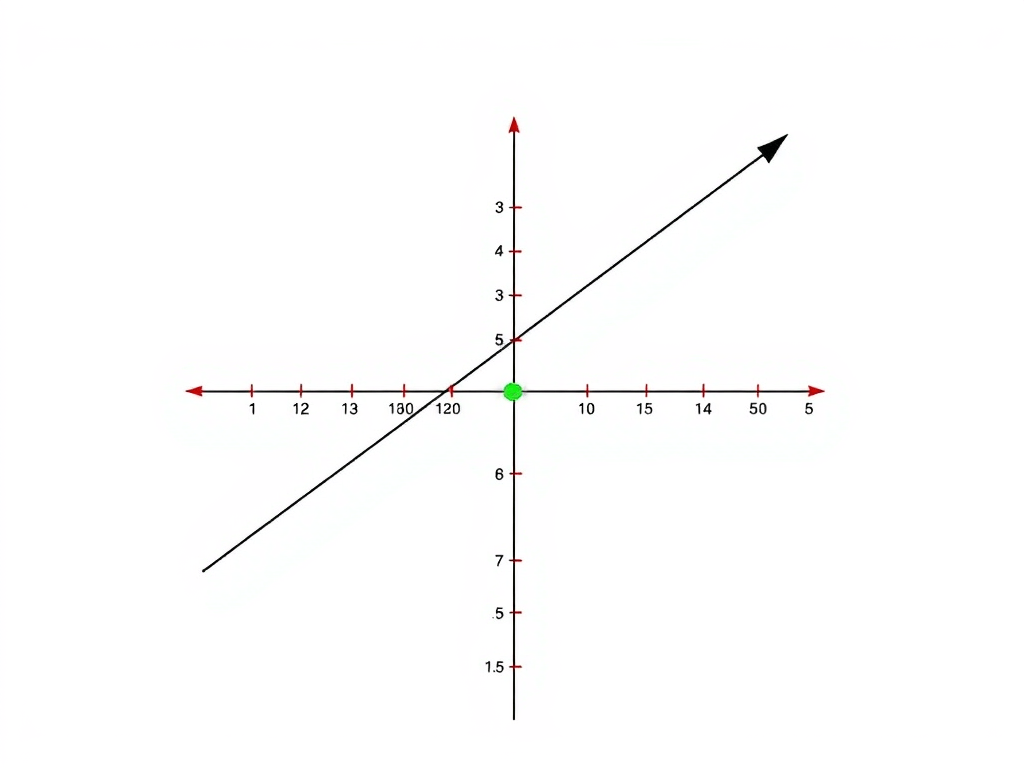
Here’s the simplified “cross method” graph of y=2x+3:
- The x-axis and y-axis cross at the origin (0,0), with arrows showing they extend in both directions.
- The red point marks the y-intercept (0,3).
- The green point shows the next step using the slope: up 2, over 1 → (1,5).
- The line passes through these points and continues infinitely.
🔑 Helpful Hints for Graphing Linear Equations
- Always start with the y-intercept (b).
- Look at the equation y=mx+b
- Plot the point (0,b) on the y-axis first.
- Example: in y=2x+3 , start at (0,3).
- Use the slope (m) as rise/run.
- Slope tells you how the line moves.
- Positive slope = line goes up from left to right.
- Negative slope = line goes down from left to right.
- Example: slope 2 means up 2, right 1.
- Plot at least 2 points before drawing the line.
- After plotting the intercept, use slope to find a second point.
- Connect them with a straight edge (ruler if possible).
- Extend the line across the graph.
- A line goes on forever in both directions, so draw it through your points across the whole grid.
- Add arrows at both ends to show it keeps going.
- Check your work.
- Pick a value of x, plug it into the equation, and see if your point is on the line.
- Example: In y=2x+3, if x=2 , then y=7. Does your line pass through (2,7)?

Example 2:
Graphing y=−x+1
- Identify slope and intercept:
- Equation: y=−x+1
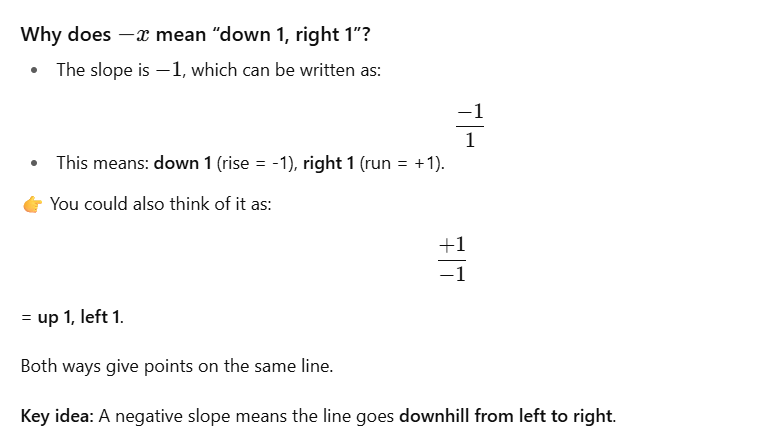
- Slope (m) = −1 → means down 1, right 1.
- Intercept (b) = 1 → y-intercept is at (0,1).
- Plot the y-intercept:
- Start at the point (0,1) on the y-axis.
- Use the slope:
- From (0,1), go down 1 and right 1 to reach (1,0).
- Plot this point too.
- Draw the line:
- Connect the points with a straight line.
- Extend across the graph with arrows on both ends.
Extra Explanation:
What the line looks like:
- It starts at (0,1).
- It moves downward as you go right (negative slope).
- The line passes through points like (1,0), (2,−1), and (−1,2).
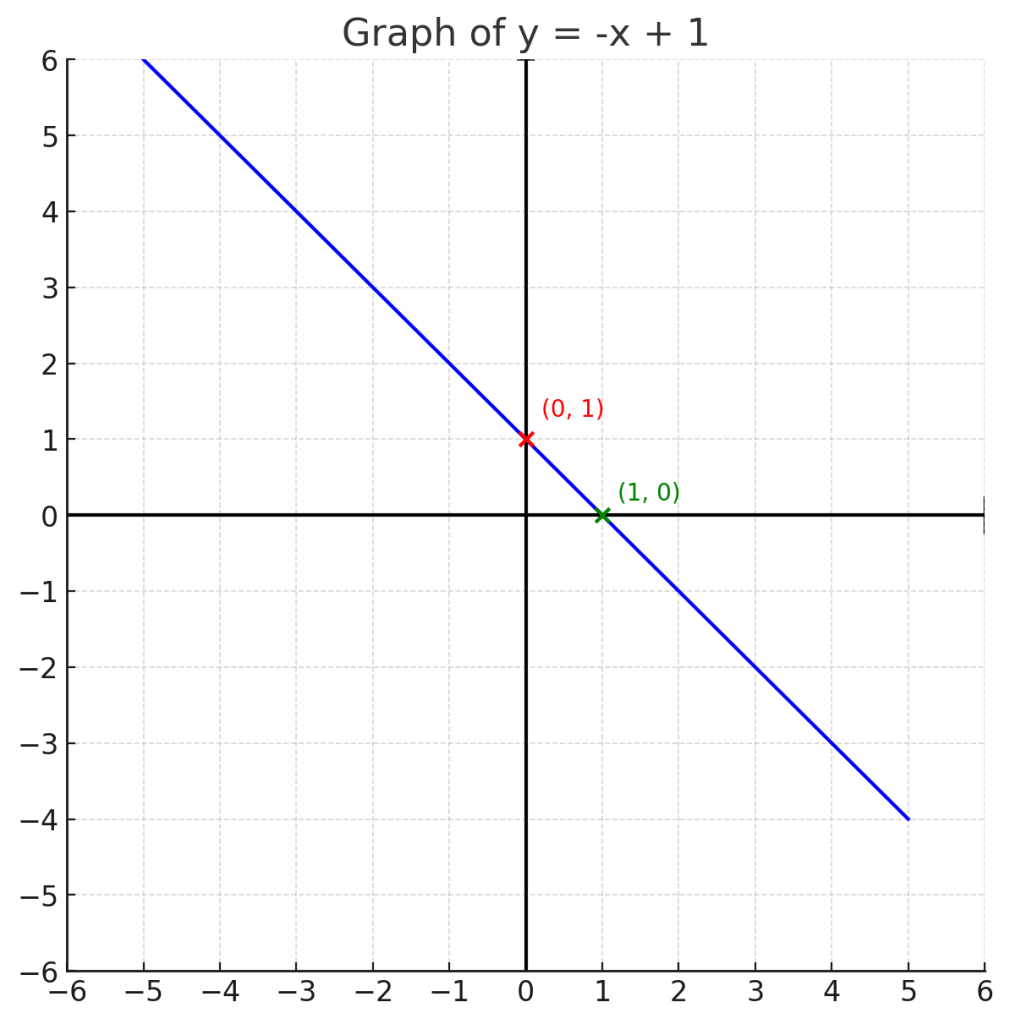
Here’s the cross-method graph of y=−x+1:
- The red point is the y-intercept (0,1).
- The green point shows the slope: from (0,1), move down 1, right 1 to reach (1,0).
- The line continues in both directions, slanting downward from left to right (negative slope).

Here’s the graph of y=−x+1 with arrows showing the rise/run method:
- From the y-intercept (0, 1), the purple arrows guide you:
- Go down 1 (rise = -1).
- Go right 1 (run = +1).
- This takes you to the next point (1,0).
Practice Worksheet: Slope-Intercept Form
For each equation:
- Identify the slope (m) and y-intercept (b).
- Plot the y-intercept on the graph.
- Use the slope (rise/run) to find at least one more point.
- Draw the line through the points.

